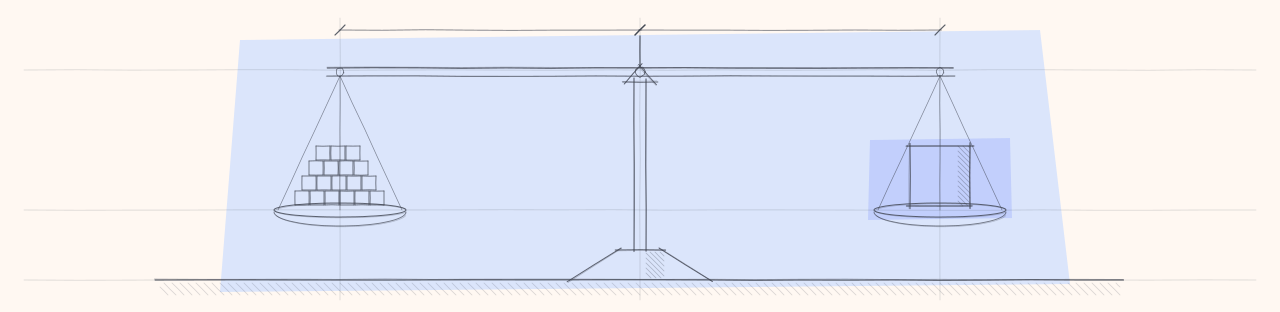
Three inputs size the CSM role
High-touch, white-glove customer success fits businesses with few, high-value, reachable accounts. It carries less well into businesses with a large, low-ACV, hard-to-reach base. Before writing CSM job descriptions, place the CX layer in context: implementation and support carry most of the day-to-day load, and CSM coverage is sized by the three inputs below. Read them together before you set headcount.
| Input, and the question it asks | What it tells you | How to get it |
|---|---|---|
| Around 50 accounts a head leaves room for real relationships. Past 200, individual account ownership becomes nominal. | Count it: active accounts ÷ CSM headcount. | |
| Many SMB owners are running their business and won’t take a recurring call regardless of CSM effort. | Measure it: trailing completed-QBR rate across the whole book. | |
| A $250/month account cannot fund the same coverage as a $250k enterprise account. | Compare it: CSM cost as a share of the ARR they manage. |
The same three inputs inform two decisions: whether to staff CSMs at all, and who owns expansion. A large base with low reachability and low ACV points toward signal-driven, specialized, pooled coverage. A small base with high reachability and high ACV supports a white-glove model. Many teams land between the two, so measure the inputs rather than assume the model.
Reachability reflects the customer base more than it reflects the team’s effort.
Treat reachability as a measured constant
A common planning error: take the customer base, divide by three, and treat the result as the quarterly QBR volume each CSM will deliver. The completed-meeting report usually comes back far lower. The first instinct is to treat the gap as a coaching problem. More often it reflects the market.
The first instinct
“Our CSMs just need better playbooks.”
When only a third of customers will complete a QBR, the limit is usually the market, not rep skill. Many SMB owners don’t want another recurring meeting. A book that mostly won’t meet leaves CSMs handling reactive support at twice the cost, while planning still assumes every account gets a live touch.
What the numbers usually say
- Completed-QBR rate across the book
- About 30% is common for SMB
- Can better playbooks push it to 70%?
- Rarely
- Base ÷ 3 = monthly QBR target?
- Overstates reality
- 70 meetings per rep per month?
- 3+ a day, not realistic
Plan around it. Measure reachability and plan around it rather than setting it as a target. Build the live motion for the customers who will engage, and cover the rest through non-meeting channels: support moments, in-product prompts, async updates, email. A CSM completing around 20 real meetings a month with engaged customers is a reasonable load. The model should reflect that it covers part of the base, not all of it.
Split the role into retention and expansion
One CSM rarely does both jobs well. The role divides into two functions with different inputs, motions and scoreboards: keeping customers, and growing them. Staff each with the people suited to it.
Keeping customers
Retention protects revenue.
Fed by
- Usage trend: sessions rising or falling
- Seats per account: champion-only is a risk flag
- Support volume and last-touch age
The motion
A Monday-morning hot sheet of at-risk accounts, often 10–15% of the base at any time. Work that list ahead of renewal rather than waiting for a scheduled check-in.
Scoreboard: saves per month, churn dollars against forecast, at-risk accounts worked.
Growing them
Expansion grows revenue.
Fed by
- The schedule: the roughly 30% who will actually meet
- Flags routed from implementation and support
- In-product hand-raises and async-QBR replies
The motion
Every opened opportunity routes here, along with outbound into the roughly 20–25% of the base that can expand. This is a sales role, so set targets and compensation accordingly.
Scoreboard: opportunities opened by source, close rate, expansion ARR per month.
Few people are both a strong closer and a disciplined account manager, but most teams already have some of each.
Make the split work
Staff by strength
Assign closers to expansion and operators to retention. Specialization lets each person cover roughly double the accounts, 200 becomes 400, because the work matches their strength.
Send a written QBR to the full base
When only a third of customers attend live QBRs, make the default a generated 6–8 slide update sent to 100% of the base: usage against potential, unused features, new products, and requests you shipped. Reserve live meetings for customers who respond.
Keep the health score simple
At low touch, external causes such as a customer’s bankruptcy or a lost contract often aren’t visible in advance. Usage is the most reliable early indicator. Act on it weekly rather than investing in a more elaborate scoring model.
Graduate the touch
Separate coverage by pricing tier. Make a dedicated CSM part of your top bundle, with good-better-best pricing where the highest tier includes white-glove support, and pool the rest under the split retention and expansion model. Customers who pay for high touch receive it; the long tail gets coverage that scales.
How to roll this out
- Measure your three inputs honestly: active accounts per CSM, trailing completed-meeting rate across the whole book, and loaded CSM cost against the ARR each one manages.
- Read the three inputs together and choose a coverage model: white glove, split coverage or pooled coverage. Plan around measured reachability rather than setting it as a coaching target.
- Name one owner for expansion. Implementation and support surface and flag opportunities but don’t own the target.
- For each add-on, decide and document where it gets sold and by whom. Revisit when new-logo close rates or time-to-value change.
- Split the CSM team into retention and expansion by strength, and align compensation to match: saves on one side, closed expansion on the other.
- Replace calendar QBRs with the written 6–8 slide update to 100% of the base. Reserve live meetings for responders and risk signals.
- Start the Monday hot sheet from usage signals before investing in a more elaborate health score.